Balance Sheet Introduction — Assets, Liabilities, and Equity
"The P&L may attract you; the Balance Sheet tells the truth."
Learning Objectives
After reading this chapter, you will be able to:
- Apply the accounting equation: Assets = Liabilities + Equity
- Calculate Debt-to-Equity, Working Capital, Book Value per Share, and ROE from a balance sheet
- Run the CFA 7-step balance sheet screen (cash, debt, receivables, inventory)
- Identify red flags: rising debt without profit, receivables outpacing revenue, negative net worth
Introduction
The P&L is the earning story; the Balance Sheet is the financial strength story. A company can show constant profit, revenue growth, and rising EPS yet remain financially weak. History is full of companies that reported years of profits but collapsed due to excessive debt, weak cash, or poor capital allocation.
Senior equity research analysts spend more time on the Balance Sheet than on the P&L — because the Balance Sheet reveals whether reported profits are backed by real assets, manageable debt, and growing shareholder equity.
Core Concepts
Financial Terms
| Term | Meaning |
|---|---|
| Balance Sheet | Snapshot of financial position at a specific date |
| Assets | Resources that generate future economic benefit |
| Liabilities | Obligations the company must settle in the future |
| Shareholders' Equity | Assets − Liabilities = owners' stake in the business |
| Current Assets | Liquid within 12 months (Cash, Receivables, Inventory) |
| Non-Current Assets | Long-term (PPE, Patents, Software) |
| Current Liabilities | Due within 12 months |
| Long-term Liabilities | Term loans, bonds, debentures |
| Net Worth | Shareholders' Equity = total net assets |
| Book Value | Equity per share |
| Working Capital | Current Assets − Current Liabilities |
| Debt-to-Equity | Total Debt ÷ Shareholders' Equity |
| P/B Ratio | Price ÷ Book Value per share |
| ROE | Net Profit ÷ Shareholders' Equity |
Investment Decision
Earning profit is important — staying financially strong is even more important.
Pre-Investment Checklist:
- ✅ Cash adequate?
- ✅ Debt controlled?
- ✅ Net Worth growing?
- ✅ Receivables in check?
- ✅ Inventory healthy?
- ✅ Book Value growing?
If all are positive → proceed to ROE, ROCE, Cash Flow, and Valuation analysis.
Practice: BEL, HAL, Nile, POEL, PFC — download Balance Sheets; calculate D/E, Book Value, and 5-year Net Worth growth.
Priority items for investors:
- Cash & Cash Equivalents — "Cash is king" (Warren Buffett: "Profit is an opinion, cash is a fact.")
- Trade Receivables — money owed by customers
- Inventory — unsold goods
- PPE — Property, Plant & Equipment
Cash vs Profit — Strength Indicator
| PAT | Cash | |
|---|---|---|
| Company A | ₹100 Cr | ₹10 Cr |
| Company B | ₹80 Cr | ₹150 Cr |
Company B is often financially stronger despite lower reported profit.
Receivables Warning
If: Receivables Growth > Revenue Growth → InvestigatePossible causes: delayed payments, weak sales quality, aggressive revenue recognition.
Inventory Warning
If: Inventory Growth >> Revenue Growth → Weak demand signalDebt analysis is the investor's first responsibility.
Debt is not always bad: Appropriate leverage can accelerate growth and boost ROE. Excessive debt increases risk — recessions can be fatal for over-leveraged companies.
ROE quality question: Is high ROE driven by an excellent business or by excessive leverage?
P/B Ratio — Sector Application
Especially useful for banks, NBFCs, and asset-heavy businesses
| P/B | Signal |
|---|---|
| < 1 | Potential value opportunity |
| 1–3 | Normal range |
| > 5 | High expectations priced in |
Hands-on drill:
- Download Balance Sheets for BEL, HAL, Nile, POEL, and PFC
- Record Cash, Total Debt, and D/E Ratio
- Calculate Book Value Per Share
- Plot 5-year Net Worth growth
- Identify the company with the strongest Balance Sheet
Formula & Explanation
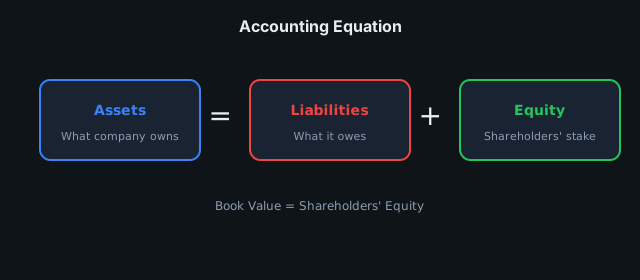
Accounting Equation (Always Balances)
Assets = Liabilities + Shareholders' EquityShareholders' Equity = Assets − LiabilitiesBook Value Per Share
Book Value Per Share = (Shareholders' Equity) ÷ (Total Outstanding Shares)Example: Equity ₹500 Cr ÷ 10 Cr shares = ₹50/share
Debt-to-Equity
Debt-to-Equity = (Total Debt) ÷ (Shareholders' Equity)| D/E Ratio | Interpretation |
|---|---|
| < 0.5 | Excellent |
| 0.5 – 1.0 | Acceptable |
| 1.0 – 2.0 | Caution |
| > 2.0 | High risk |
Working Capital
Working Capital = Current Assets − Current LiabilitiesReturn on Equity
ROE = (Net Profit) ÷ (Shareholders' Equity)Visual Guide
Worked Example — Indian Market
Example 1 — Accounting Equation (Illustrative)
| Item | ₹ Cr |
|---|---|
| Total Assets | 500 |
| Total Debt (Liabilities) | 200 |
| Shareholders' Equity | 300 |
Check: 500 = 200 + 300 ✓ → D/E = 200 ÷ 300 = 0.67 (acceptable range).
Example 2 — Receivables Red Flag
| Year | Revenue (₹ Cr) | Receivables (₹ Cr) | Receivables/Revenue |
|---|---|---|---|
| FY22 | 1,000 | 120 | 12% |
| FY24 | 1,400 | 280 | 20% |
Revenue +40% but receivables +133% → collection risk; triangulate with Cash Flow Statement.
Real World Example
You start a business with ₹10 lakh of your own capital and a ₹5 lakh bank loan — ₹15 lakh total resources.
| Amount | |
|---|---|
| Assets | ₹15 lakh |
| Liabilities | ₹5 lakh |
| Equity | ₹10 lakh |
This structure is the foundation of every company's Balance Sheet — a snapshot of financial position at a specific date. Listed companies report this quarterly and annually under Ind AS.
Case Study
Before applying P/E or other valuation ratios, analyse BEL, HAL, Nile, POEL, and PFC on:
- Cash position
- Total Debt
- Book Value / Net Worth
- Working Capital
- Receivables trend
- Inventory trend
Financial strength — not headline profit alone — determines whether a company can survive downturns and fund growth without diluting shareholders.
CFA Exam Tip
CFA Balance Sheet Framework:
| Step | Focus |
|---|---|
| 1 | Cash Position |
| 2 | Total Debt |
| 3 | Debt-to-Equity |
| 4 | Receivables Trend |
| 5 | Inventory Trend |
| 6 | Book Value Growth |
| 7 | Net Worth Growth |
Working Capital nuance: Positive working capital is generally healthy; excessively high working capital may signal capital inefficiency.
Key insight: Profit can be managed; Cash Flow and the Balance Sheet are harder to manipulate. A strong Balance Sheet is the foundation of long-term survival.
Common Mistakes
- Debt rising fast while profit is not
- Receivables growing faster than revenue
- Inventory piling up without sales growth
- Continuous equity dilution (new share issuance)
- Negative Net Worth
- Cash declining while profit is rising
- Net Worth consistently falling
Key Takeaways
- The Balance Sheet is a financial position snapshot at a point in time.
- Assets, Liabilities, and Equity are the three pillars.
- Cash is the most important asset; profit ≠ cash.
- Debt is the primary risk factor.
- Book Value and Net Worth reflect real ownership value.
- Receivables and inventory quality are business health signals.
- A strong Balance Sheet is the foundation of long-term success.
Practice Questions
Chapter: Balance Sheet Intro | Part 02 | Try before reading answers.
Q1 (Conceptual): What is the core message of this chapter in one sentence?
Q2 (Calculate): Equity ₹500 Cr ÷ 10 Cr shares — Book Value per share?
Q3 (Application): Assets ₹500 Cr, Liabilities ₹200 Cr, Equity ₹300 Cr — D/E = 0.67. What does it imply?
Q4 (Red Flag): Debt rising fast but profit not — why is this concerning?
Q5 (CFA Style): What is a common CFA trap when interpreting the Balance Sheet?
Q6 (Decision): Balance Sheet looks strong but valuation is stretched — invest, wait, or avoid?
Q7 (Lab): Complete one Balance Sheet Intro exercise in Part 02 Practice Lab.
Answer Key
Q1 (Conceptual)
The Balance Sheet is a financial position snapshot at a point in time — it reveals strength, not just earnings.
Q2 (Calculate)
₹50/share
Q3 (Application)
D/E of 0.67 is in the acceptable range — moderate leverage, not excessive.
Q4 (Red Flag)
Debt rising without profit growth suggests the company is borrowing to survive or fund unproductive assets — investigate cash flow and ROCE.
Q5 (CFA Style)
Treating a strong snapshot in isolation without trend analysis, consolidated figures, or Cash Flow triangulation.
Q6 (Decision)
Usually wait for margin of safety unless quality is exceptional. A strong Balance Sheet does not justify overpaying.
Q7 (Lab)
See Part 02 Practice Lab and verify with lab Answer Key.
Go deeper: Part 02 Practice Lab
FAQ {#faq}
Q: Assets = Liabilities + Equity — why does it matter to investors?
A: Equity is shareholders' book stake; growing equity with stable debt supports wealth compounding.
Q: Goodwill-heavy balance sheet — caution?
A: Acquisition premium may impair — write-down risk; check tangible asset backing.
Q: Why read contingent liabilities in the notes?
A: Hidden debt or litigation can wipe out equity — off-balance obligations can materialise suddenly.
Q: Standalone vs consolidated — which for analysis?
A: Consolidated — parent-only standalone misses subsidiaries' debt and profits (CFA standard).
Q: How do I drill these concepts in the Practice Lab?
A: Open Part 02 Practice Lab → use the FAQ Drill row for balance-sheet-intro to practice on real stocks, then verify answers against the Chapter FAQ Quick Index.
Practice Lab FAQ: Full part FAQ index — Part 02 Practice Lab
Related Topics
- Previous Chapter: 06-Profit And Loss Statement
- Next Chapter: 08-Balance Sheet Practical
- Part Overview: Part 02 Financial Statements
- Book Index: Full Table of Contents
Disclaimer: Educational content only. Not investment advice. Consult a qualified financial advisor before investing.