Balance Sheet Profitability — ROE, ROCE, and DuPont
"A strong balance sheet is the foundation; profitability ratios show how well shareholders' capital is being used."
Learning Objectives
After reading this chapter, you will be able to:
- Link Balance Sheet strength (equity, debt, working capital) to profitability ratios ROE and ROCE
- Interpret P/E, P/B, and Graham Number in the context of balance sheet quality
- Spot when high ROE is inflated by leverage rather than operational excellence
- Apply the profitability + valuation checklist before moving to deeper analysis
Introduction
The Balance Sheet tells you how strong a company is. Profitability analysis tells you how efficiently that strength is converted into returns for shareholders. This chapter bridges balance sheet quality to ROE, ROCE, P/E, P/B, Graham Number, and Margin of Safety — with emphasis on Indian listed companies.
After you know cash, debt, and net worth, the next question is: Is this company earning good returns on the capital entrusted to it?
Core Concepts
Financial Terms
| Term | Meaning |
|---|---|
| ROE (Return on Equity) | Return earned on shareholders' equity |
| ROCE (Return on Capital Employed) | EBIT ÷ Capital Employed — efficiency on debt + equity |
| P/E (Price to Earnings) | Share Price ÷ EPS — valuation multiple on earnings |
| P/B (Price to Book) | Share Price ÷ Book Value — useful for asset-heavy businesses |
| Graham Number | Fair value ceiling derived from EPS and Book Value |
| Margin of Safety | Discount buffer between intrinsic value and buy price |
| DuPont Analysis | ROE decomposed into margin, turnover, and leverage |
Investment Decision
Consider further research when:
- ✅ Balance Sheet Strong
- ✅ ROE > 15%
- ✅ ROCE > 15%
- ✅ Growth Good
- ✅ Valuation Fair (P/E, P/B, Graham, MoS context)
Pause or reject when: leverage inflates ROE, valuation ignores growth/quality, or Margin of Safety is absent.
| ROE | Meaning |
|---|---|
| <10% | Weak |
| 10–15% | Fair |
| 15–20% | Good |
| >20% | Excellent |
Analyst Warning: High ROE ≠ Low Risk
| Company A | Company B | |
|---|---|---|
| Net Profit | ₹100 Cr | ₹100 Cr |
| Equity | ₹500 Cr | ₹250 Cr |
| ROE | 20% | 40% |
| Debt | ₹0 | ₹1,500 Cr |
Company B has higher ROE but also much higher risk. Always read ROE alongside debt.
| Pattern | Interpretation |
|---|---|
| ROE >> ROCE | Probably leverage-driven ROE |
| ROE ≈ ROCE | Business quality may be strong |
Quality Business Screening: ROE > 15%, ROCE > 15%, Debt/Equity < 0.5 — if all three are met, the company is worth further study.
Two companies of equal quality:
| Company A | Company B | |
|---|---|---|
| Intrinsic Value | ₹1,000 | ₹1,000 |
| Current Price | ₹700 | ₹1,800 |
Company A is clearly the better investment candidate — same business, better price.
P/E note: Low P/E is not always good; high P/E is not always bad — read in growth context.
P/B note: Particularly useful for banks, NBFCs, and asset-heavy businesses.
Graham Number: If Current Price < Graham Number, further study is warranted — it combines earnings and book value support.
Formula & Explanation
Return on Equity (ROE)
ROE = (Net Profit) ÷ (Shareholders' Equity) × 100Example: Net Profit = ₹100 Cr, Equity = ₹500 Cr → ROE = 20%
Return on Capital Employed (ROCE)
ROCE = (EBIT) ÷ (Capital Employed) × 100Example: EBIT = ₹150 Cr, Capital Employed = ₹750 Cr → ROCE = 20%
DuPont ROE Decomposition
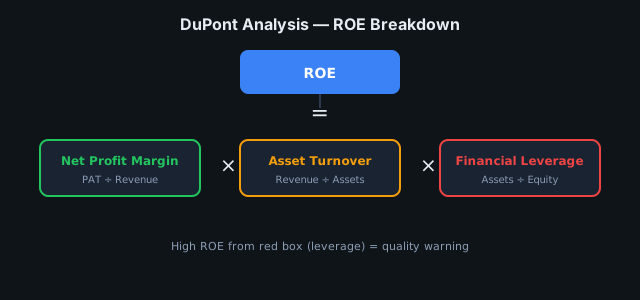
ROE = Net Profit Margin × Asset Turnover × Financial LeverageROE = (PAT ÷ Revenue) × (Revenue ÷ Assets) × (Assets ÷ Equity)High ROE driven mainly by the leverage component (Assets ÷ Equity) is a quality warning.
Price to Earnings (P/E)
P/E = (Share Price) ÷ (EPS)Example: Price = ₹200, EPS = ₹20 → P/E = 10
Price to Book (P/B)
P/B = (Share Price) ÷ (Book Value per Share)Example: Price = ₹100, Book Value = ₹80 → P/B = 1.25
Margin of Safety
Margin of Safety = (Intrinsic Value − Buy Price) ÷ (Intrinsic Value) × 100Example: Intrinsic Value = ₹1,000, Buy Price = ₹700 → MoS = 30%
Visual Guide
Worked Example — Indian Market
ROE + ROCE Stack (Illustrative)
| Metric | Company A | Company B |
|---|---|---|
| ROE | 22% | 24% |
| ROCE | 20% | 14% |
| D/E | 0.3x | 2.1x |
Company A: ROE ≈ ROCE + low debt → quality signal. Company B: ROE >> ROCE → leverage inflating returns; verify interest coverage.
Real World Example
Suppose you have analysed the Balance Sheet. You now know: how much cash, how much debt, how much net worth, and whether receivables and inventory are healthy.
But an important question still remains:
"Is this company generating good returns for its shareholders?"
Profitability analysis starts here. The Balance Sheet shows strength; profitability shows returns.
Case Study
HDFC Bank: For banks, P/B and ROE together are standard practice — high ROE + reasonable P/B often signals efficient capital use.
Asian Paints: Quality compounders often trade at premium P/E because the market pays for growth — low P/E alone is not a sufficient filter.
Defence names (BEL, HAL): Interpret ROCE alongside order-book visibility and government payment cycles — profitability ratios need sector context.
CFA Exam Tip
Professional analysts follow a four-phase framework:
| Phase | Focus |
|---|---|
| 1. Balance Sheet | Cash, Debt, Net Worth |
| 2. Profitability | ROE, ROCE, Profit Growth |
| 3. Valuation | P/E, P/B, Graham Number, Margin of Safety |
| 4. Decision | Integrated go/no-go |
CFA Golden Rule: It is not enough to buy a good company; it is not enough to buy a cheap company. Successful investing requires excellent business + appropriate valuation + strong Balance Sheet — all three together. Wealth creation starts when all three align.
Common Mistakes
- ROE > 20% with extremely high Debt/Equity
- ROE >> ROCE consistently (leverage masking weak operations)
- Low P/E with declining earnings (value trap)
- High P/E without growth justification
- Graham attractive on paper but deteriorating fundamentals
- No Margin of Safety at entry
Key Takeaways
- Balance sheet analysis is the logical next step before profitability and valuation.
- ROE measures shareholders' return; ROCE measures total capital efficiency — read both together.
- ROE ≈ ROCE + low debt often signals quality; ROE >> ROCE signals a leverage check.
- Valuation (P/E, P/B, Graham Number, Margin of Safety) determines whether quality is worth buying.
- Wealth creation = great business + fair price + strong balance sheet — not any one alone.
Practice Questions
Chapter: Balance Sheet Profitability | Part 02 | Try before reading answers.
Q1 (Conceptual): What is the core message of this chapter in one sentence?
Q2 (Calculate): Net Profit ₹100 Cr, Equity ₹500 Cr — ROE?
Q3 (Application): ROE = 20%, ROCE = 14%, D/E = 2.0 — what does it imply?
Q4 (Red Flag): ROE 20% with extremely high Debt/Equity — why is this risky?
Q5 (CFA Style): What is a CFA-style trap when interpreting ROE?
Q6 (Decision): Profitability looks strong but valuation is stretched — invest, wait, or avoid?
Q7 (Lab): Complete one Balance Sheet Profitability exercise in Part 02 Practice Lab.
Answer Key
Q1 (Conceptual)
Balance sheet strength must be linked to ROE/ROCE and valuation before making an investment decision.
Q2 (Calculate)
ROE = 100 ÷ 500 × 100 = 20%
Q3 (Application)
ROE >> ROCE with high D/E suggests leverage is inflating returns — verify interest coverage and cash flow.
Q4 (Red Flag)
High ROE from leverage, not operations — a downturn can wipe out equity quickly.
Q5 (CFA Style)
Accepting high ROE without DuPont decomposition or debt context.
Q6 (Decision)
Usually wait for margin of safety unless quality is exceptional. Strong ROE does not justify overpaying.
Q7 (Lab)
See Part 02 Practice Lab and verify with lab Answer Key.
Go deeper: Part 02 Practice Lab
FAQ {#faq}
Q: ROE >> ROCE consistently — meaning?
A: Leverage is inflating ROE — debt is masking weak operational returns; check interest coverage.
Q: High ROE + high debt — quality?
A: Not quality compounding — ROE is boosted by financial engineering; prefer ROE ≈ ROCE + low debt.
Q: Low P/E + declining earnings — trap?
A: Classic value trap — cheap multiple on shrinking earnings is a melting ice cube.
Q: Graham attractive + weak balance sheet?
A: Altman Z / debt check mandatory — cheap on Graham alone can be distress, not value.
Q: How do I drill these concepts in the Practice Lab?
A: Open Part 02 Practice Lab → use the FAQ Drill row for balance-sheet-profitability to practice on real stocks, then verify answers against the Chapter FAQ Quick Index.
Practice Lab FAQ: Full part FAQ index — Part 02 Practice Lab
Related Topics
- Previous Chapter: 08-Balance Sheet Practical
- Next Chapter: 10-Balance Sheet Deep Dive
- Part Overview: Part 02 Financial Statements
- Book Index: Full Table of Contents
Disclaimer: Educational content only. Not investment advice. Consult a qualified financial advisor before investing.