Balance Sheet Practical — Ratios, Working Capital, and Red Flags
"Profit can be managed; the Cash Flow Statement and Balance Sheet are much harder to hide."
Learning Objectives
After reading this chapter, you will be able to:
- Run the 5-minute analyst sequence: Cash → Debt → Receivables → Inventory → Net Worth
- Compare two companies with similar P&L but different balance sheet strength
- Apply the productive debt test (borrowing cost vs ROCE)
- Prioritise balance sheet over headline profit in first-pass screening
Introduction
Two companies: Company A — Revenue ₹10,000 Cr, Profit ₹1,000 Cr. Company B — Revenue ₹8,000 Cr, Profit ₹800 Cr. Most investors gravitate toward Company A.
An experienced analyst opens the Balance Sheet first — because profit shows how much was earned; the Balance Sheet shows how strong the company is, whether it can survive a crisis, and whether growth is sustainable.
Core Concepts
Financial Terms
| Term | Meaning |
|---|---|
| Financial Strength | Capacity to survive financial stress |
| Liquidity | Ability to meet short-term obligations |
| Solvency | Capacity to service long-term debt |
| Trade Receivables | Amount owed by customers |
| Inventory | Unsold stock in warehouse |
| Leverage | Funding the business with debt |
| Equity Dilution | Ownership % decreases when new shares are issued |
| Net Worth Growth | Accumulation of shareholders' wealth over time |
Investment Decision
If you had to buy the entire business, would you feel comfortable after reading the Balance Sheet?
Real Investor Checklist (pre-investment):
✅ Cash growing ✅ Debt controlled ✅ Net Worth growing ✅ Receivables controlled ✅ Inventory healthy ✅ Book Value growing
All "Yes" → next step: Profitability + Valuation Analysis.
Practice: BEL, HAL, Nile, POEL, PFC — record Cash, Debt, D/E, Receivables, Inventory, Net Worth, and Book Value.
First time analysing a company — only 5 minutes? Check these items first:
Step 1: Cash vs Debt
| Scenario | Signal |
|---|---|
| Cash ₹1,000 Cr, Debt ₹100 Cr | No debt pressure |
| Cash ₹100 Cr, Debt ₹5,000 Cr | Immediate caution |
Step 2: Debt-to-Equity
| Company | Debt | Equity | D/E |
|---|---|---|---|
| A | ₹100 Cr | ₹1,000 Cr | 0.1 — Strong |
| B | ₹2,000 Cr | ₹1,000 Cr | 2.0 — High risk |
Step 3: Receivables Trend
| Year | Revenue | Receivables |
|---|---|---|
| 2024 | ₹100 Cr | ₹20 Cr |
| 2025 | ₹120 Cr (+20%) | ₹60 Cr (+200%) |
Analyst question: "Are customers not paying?" — Red Flag.
Step 4: Inventory Trend
| Year | Sales | Inventory |
|---|---|---|
| 2024 | ₹100 Cr | ₹10 Cr |
| 2025 | ₹110 Cr (+10%) | ₹40 Cr (+300%) |
Signal: Goods not selling; demand weakening.
Step 5: Net Worth Growth
| Year | Net Worth |
|---|---|
| 2021 | ₹100 Cr |
| 2022 | ₹130 Cr |
| 2023 | ₹170 Cr |
| 2024 | ₹220 Cr |
| 2025 | ₹300 Cr |
Steady compounding of financial strength — positive signal.
Open Balance Sheets for BEL, HAL, Nile, POEL, and PFC and record:
- Cash
- Debt
- Debt/Equity
- Receivables
- Inventory
- Net Worth
- Book Value
Then ask: If I had to buy the entire business, would I feel comfortable after reading the Balance Sheet? — "Yes" → proceed to Profitability and Valuation.
Formula & Explanation
Net Worth
Net Worth (Equity) = Total Assets − Total LiabilitiesBook Value & P/B
Book Value Per Share = (Equity) ÷ (Outstanding Shares)P/B = (Market Price) ÷ (Book Value Per Share)Example: Equity ₹500 Cr, 10 Cr shares → Book Value ₹50. Share at ₹40 → P/B = 0.8 (further study warranted).
Working Capital
Working Capital = Current Assets − Current LiabilitiesExample: Current Assets ₹500 Cr − Current Liabilities ₹300 Cr = ₹200 Cr
Debt-to-Equity Quick Reference
| D/E | Meaning |
|---|---|
| <0.5 | Excellent |
| 0.5–1 | Safe |
| 1–2 | Caution |
| >2 | High risk |
Productive Debt Test
If: Borrowing Cost (10%) < ROCE (25%) → Debt can be value-accretiveIf: Growth weak + Interest high → Same debt becomes dangerousVisual Guide
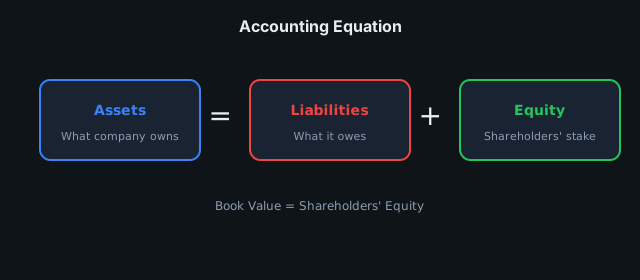
Worked Example — Indian Market
Example 1 — Two Companies, Same Profit Story
| Metric | Company A | Company B |
|---|---|---|
| Revenue (₹ Cr) | 10,000 | 8,000 |
| PAT (₹ Cr) | 1,000 | 800 |
| Cash (₹ Cr) | 200 | 1,500 |
| Total Debt (₹ Cr) | 4,500 | 500 |
| D/E | 2.5 | 0.3 |
Headline: A looks stronger on profit. Balance sheet: B survives downturns; A carries leverage risk.
Example 2 — Productive Debt Test
Borrowing cost 10%, ROCE 25% → debt can be value-accretive.
Borrowing cost 12%, ROCE 8%, weak growth → same debt becomes dangerous.
Real World Example
| Asset | Value |
|---|---|
| Cash | ₹2 lakh |
| Stock | ₹3 lakh |
| Equipment | ₹5 lakh |
| Total Assets | ₹10 lakh |
| Liability | Value |
|---|---|
| Bank Loan | ₹4 lakh |
Net Worth = ₹10 lakh − ₹4 lakh = ₹6 lakhThe same principle applies to every listed company — only the numbers are larger.
Case Study
BEL (Large Cap Defence): Analyst checks — Cash level? Debt? Net Worth growing? Working Capital controlled? Receivables spike?
Small Cap: Check debt first — small caps often fail due to debt and cash flow, not bad products alone.
Companies for practice: BEL, HAL, Nile, POEL, PFC
CFA Exam Tip
Analyst View — first questions (not P/E):
- How much cash?
- How much debt?
- How much Net Worth?
- Is the 5-year Balance Sheet stronger or weaker?
Golden Rule sequence:
Cash → Debt → Receivables → Inventory → Net Worth
THEN → Profit
7-Step Framework (if time permits): Cash → Debt → D/E → Receivables → Inventory → Book Value Growth → Net Worth Growth
If strong → proceed to ROE, ROCE, Cash Flow, and Valuation.
Key insight: Experienced investors look at the Balance Sheet before the P&L. Profit can look attractive; the Balance Sheet determines survival.
Common Mistakes
- Debt rapidly increasing
- Receivables growing faster than revenue
- Inventory accumulating without sales
- Cash declining
- Net Worth consistently falling
- D/E > 2 without justified ROCE
- Equity dilution (repeated share issuance)
Key Takeaways
- The Balance Sheet is the company's financial strength X-ray.
- Cash matters more than accounting profit.
- Debt is the biggest risk factor.
- Receivables and inventory are business quality indicators.
- Net Worth and Book Value reflect shareholders' real wealth.
- A strong Balance Sheet is a strong investment foundation.
- Great investors look at the Balance Sheet first, profit later.
Practice Questions
Chapter: Balance Sheet Practical | Part 02 | Try before reading answers.
Q1 (Conceptual): What is the core message of this chapter in one sentence?
Q2 (Calculate): Book Value ₹50, Market Price ₹40 — P/B?
Q3 (Application): Current Assets ₹500 Cr, Current Liabilities ₹300 Cr — Working Capital?
Q4 (Red Flag): Debt rapidly increasing — why avoid relying on the Balance Sheet alone?
Q5 (CFA Style): What is a CFA-style trap when interpreting balance sheet practical analysis?
Q6 (Decision): Balance Sheet looks strong but valuation is stretched — invest, wait, or avoid?
Q7 (Lab): Complete one Balance Sheet Practical exercise in Part 02 Practice Lab.
Answer Key
Q1 (Conceptual)
The Balance Sheet is the company's financial strength X-ray — check it before trusting headline profit.
Q2 (Calculate)
P/B = 0.8
Q3 (Application)
₹200 Cr positive working capital — generally healthy liquidity.
Q4 (Red Flag)
Rising debt without matching cash flow or ROCE — triangulate with interest coverage and CFO trend.
Q5 (CFA Style)
Screening on P/E or profit first without the Cash → Debt → Receivables sequence.
Q6 (Decision)
Usually wait for margin of safety unless quality is exceptional. Balance sheet strength does not justify overpaying.
Q7 (Lab)
See Part 02 Practice Lab and verify with lab Answer Key.
Go deeper: Part 02 Practice Lab
FAQ {#faq}
Q: Current ratio < 1 — always bad?
A: Not always — negative working capital models (e.g. some retailers) can be fine; sector context is essential.
Q: Debt/Equity rising for 3 years — action?
A: Check interest coverage + cash flow triangulation; if coverage is falling → downgrade thesis or avoid.
Q: Promoter pledge increasing — signal?
A: Financial stress / control risk — even if profits look fine, pledge >50% is a serious red flag.
Q: Inventory days rising sharply?
A: Weak demand or channel stuffing — revenue quality is suspect; cross-check with CFO trend.
Q: How do I drill these concepts in the Practice Lab?
A: Open Part 02 Practice Lab → use the FAQ Drill row for balance-sheet-practical to practice on real stocks, then verify answers against the Chapter FAQ Quick Index.
Practice Lab FAQ: Full part FAQ index — Part 02 Practice Lab
Related Topics
- Previous Chapter: 07-Balance Sheet Intro
- Next Chapter: 09-Balance Sheet Profitability
- Part Overview: Part 02 Financial Statements
- Book Index: Full Table of Contents
Disclaimer: Educational content only. Not investment advice. Consult a qualified financial advisor before investing.