Return on Equity (ROE) — Profitability and Leverage
Learning Objectives
After reading this chapter, you will be able to:
- Explain how ROE measures return on Shareholders' Equity (Book Value). High sustained ROE often creates wealth through compounding. But debt can inflate ROE artificially — always pair with ROCE and Debt analysis. Buffett seeks consistent high ROE with low debt. Professional analysts ask: What return are shareholders earning — and is it driven by quality or by debt?
- Apply ROE (Return on Equity) metrics and formulas using consolidated NSE/BSE annual report data
- Identify red flags when interpreting ROE (Return on Equity): High ROE + Very High Debt
- Connect ROE (Return on Equity) analysis to peer comparison and buy/hold/avoid decisions
Introduction
If you could choose only one ratio to form an initial view of company quality, ROE would rank near the top. ROE answers:
"How efficiently is Management using shareholders' money?"
Core Concepts
Financial Terms
| Term | Meaning |
|---|---|
| ROE | Return on Equity — Net Profit ÷ Shareholders' Equity |
| Shareholders' Equity | Assets − Liabilities = Book Value |
| PAT | Profit After Tax — Net Profit |
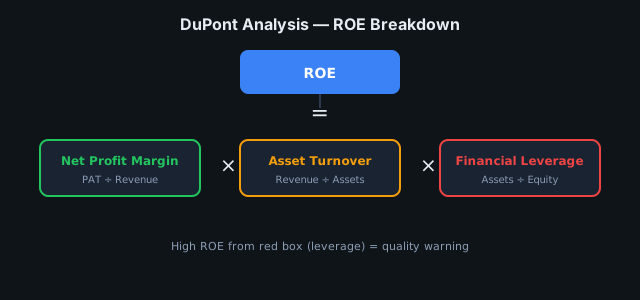
| DuPont Analysis | ROE = Profit Margin × Asset Turnover × Financial Leverage |
| Compounding Machine | High ROE + Profit Reinvestment → Book Value Growth |
Investment Decision
Combined framework:
| Check | Threshold |
|---|---|
| ROE | > 15% (industry-adjusted) |
| Debt | Low/Controlled |
| Cash Flow | Strong |
| Book Value Growth | Positive |
| ROCE | Compare with ROE |
Decision: ROE > 15% + Low Debt + Strong Cash Flow + Growing Book Value → worth further study.
Golden Rule: High ROE due to High Debt = biggest ROE trap. Never analyze ROE in isolation.
"Revenue Growth is good; Profit Growth is better; but sustained high return on shareholders' capital matters most."
| Item | Amount |
|---|---|
| Net Profit | ₹100 Cr |
| Shareholders' Equity | ₹500 Cr |
| ROE | 20% |
₹20 Profit on every ₹100 of Equity — Management generates 20% return on shareholders' capital.
| Company A | Company B | |
|---|---|---|
| Equity | ₹1000 Cr | ₹1000 Cr |
| Profit | ₹50 Cr | ₹250 Cr |
| ROE | 5% | 25% |
Company B is clearly superior — more Profit from the same capital.
| Company A | Company B | |
|---|---|---|
| Equity | ₹1000 Cr | ₹200 Cr |
| Debt | ₹0 | ₹5000 Cr |
| Profit | ₹200 Cr | ₹200 Cr |
| ROE | 20% | 100% |
Company B is not superior — ROE is artificially inflated by Debt. Always check Debt and ROCE.
| ROE | Interpretation |
|---|---|
| <10% | Weak |
| 10–15% | Fair |
| 15–20% | Good |
| 20–25% | Very Good |
| >25% | Excellent |
Industry norms vary — compare within peer group.
Positive Trend:
| Year | ROE |
|---|---|
| 2021 | 10% |
| 2022 | 12% |
| 2023 | 15% |
| 2024 | 18% |
| 2025 | 22% |
Warning Trend:
| Year | ROE |
|---|---|
| 2021 | 25% |
| 2022 | 20% |
| 2023 | 15% |
| 2024 | 10% |
| 2025 | 7% |
Formula & Explanation
DuPont Analysis (Advanced CFA)
Why did ROE rise — Margin, Asset Efficiency, or Debt?
Visual Guide
Worked Example — Indian Market
ROE + DuPont (illustrative)
PAT ₹45,000 Cr, Equity ₹90,000 Cr → ROE 50% (illustrative mega-cap). Net Margin 18.75% × Asset Turnover 2.0 × Leverage 1.33 ≈ 50%. Ask: ROE from operations or debt?
Real World Example
Two friends started a business with ₹10 lakh each:
| Friend A | Friend B | |
|---|---|---|
| Capital | ₹10 lakh | ₹10 lakh |
| Annual Profit | ₹1 lakh | ₹3 lakh |
Friend B earned more profit from the same capital — that is the core idea behind ROE.
FD Analogy: A Bank pays ₹7 on a ₹100 FD (7%); if a Business earns ₹20 (20%), ROE = 20%.
Case Study
| Company | Key ROE Checks |
|---|---|
| ICICI Bank | ROE Trend, Loan Growth, NPA Trend |
| PFC | ROE, Asset Quality, Government Exposure |
| TCS | ROE, Cash Flow, Margin Stability |
Warren Buffett: For decades has sought Consistently High ROE + Low Debt — a sign of Quality Business.
ROE + Compounding: 20% ROE + Profit Reinvestment → Book Value grows faster → Long-term Share Price follows.
CFA Exam Tip
ROE = Management efficiency on Shareholders' capital. Trend > Single Year — 5–10 year trend essential.
Critical checks alongside ROE:
- Debt/Equity ratio
- ROCE (debt-adjusted view)
- Cash Flow vs Profit
- Book Value Growth
DuPont insight: High ROE from leverage (Debt) vs operations (Margin/Turnover) — fundamentally different quality.
Common Mistakes
- High ROE + Very High Debt
- ROE continuously declining
- Profit rising but Cash Flow not
- ROE boosted by one-time profit
- Book Value not growing despite high ROE
Key Takeaways
ROE measures return on Shareholders' Equity (Book Value). High sustained ROE often creates wealth through compounding. But debt can inflate ROE artificially — always pair with ROCE and Debt analysis. Buffett seeks consistent high ROE with low debt. Professional analysts ask: What return are shareholders earning — and is it driven by quality or by debt?
Practice Questions
Chapter: ROE (Return on Equity) | Part 03 | Try before reading answers.
Q1 (Conceptual): What is the core message of this chapter in one sentence?
Q2 (Calculate): PAT Rs. 500 Cr, Equity Rs. 2,500 Cr — ROE?
Q3 (DuPont): High ROE from leverage vs operations — which is safer?
Q4 (Red Flag): High ROE + very high debt?
Q5 (CFA Style): ROE boosted by one-time profit?
Q6 (Decision): ROE looks strong but valuation stretched — invest, wait, or avoid?
Q7 (Lab): Part 03 Practice Lab DuPont drill.
Answer Key
Q1 (Conceptual)
ROE measures return on Shareholders' Equity — always pair with ROCE and debt analysis.
Q2 (Calculate)
20%
Q3 (DuPont)
Operations — check ROCE and D/E
Q4 (Red Flag)
Leverage inflates ROE — pair with ROCE
Q5 (CFA Style)
Normalize; use 5-year trend
Q6 (Decision)
Usually wait for MOS unless quality exceptional.
Q7 (Lab)
Go deeper: Part 03 Practice Lab
FAQ {#faq}
Q: What should I check alongside ROE evaluation?
A: ROE continuously declining — triangulate with ROCE, debt, and cash flow.
Q: How do I connect ROE theory to Indian market practice?
A: Use Screener/Trendlyne + company annual reports — plot the same metrics over 3 years; paper formulas alone are insufficient.
Q: Why avoid relying on ROE when debt is very high?
A: High ROE + Very High Debt — leverage inflates ROE; quality may be weaker than the headline ratio suggests.
Q: Why is rising Profit without rising Cash Flow a red flag for ROE?
A: Accounting profit may not convert to cash — sustainability of ROE is in doubt.
Q: How do I drill this chapter's concepts in the Practice Lab?
A: Open Part 03 Practice Lab → use the FAQ Drill row for return-on-equity to practice on real stocks, then verify answers against the Chapter FAQ Quick Index.
Practice Lab FAQ: Full part FAQ index — Part 03 Practice Lab
Related Topics
- Previous Chapter: 19-Price To Book Ratio
- Next Chapter: 21-Return On Capital Employed
- Part Overview: Part 03 Fundamental Analysis
- Book Index: Full Table of Contents
Disclaimer: Educational content only. Not investment advice. Consult a qualified financial advisor before investing.